
Task Summary
When collecting data there are different representations we can have for them (e.g. using tables, graphs, etc.). This lesson will allow students to create data visualisations for location-based data.
Learn MorePreparation:
Students are expected to
- Have a basic understanding of measures of central tendency (e.g. mean, median, mode) and measures of spread (range, interquartile range, standard deviation).
- Have at least a basic CoSpaces account setup. To use Merge Cubes in CoSpaces, your class needs to have a Pro account and the Merge Cube add-on.
- Need to have an understanding of basic world-building using CoSpaces. If not, it is recommended to spend at least a 1×60 minute lesson to learn the basics. There are tutorials linked in the resources section.
Teachers should make sure that:
- Devices are charged (if using)
- Students are able to access YouTube videos.
- Presentation slide deck has been checked.
- A copy of the Student Digital Notebook has been distributed to students and they have downloaded/ made a copy for themselves.
Learning Sequence
Introduction
Select and show students different data visualisation methods below
- Hans Rosling’s 200 Countries, 200 Years, 4 Minutes – The Joy of Stats – BBC Four
- 21 Years of the NASDAQ in VR
Discussion
- Discuss with students the advantages or disadvantages of these methods of displaying data (compared to traditional methods such as tables, graphs, etc.).
- Students write down their responses on page 4 of the Student Digital Notebook Data Visualisation
Research
Students research topics to create a 3D population map, suggestions include:
- Population in each state
- Australian Bureau of Statistics Census data
- Average Income
- Education attainment
- Ethnic Origins
- Political Affiliation
Students answer the questions on pages 5-6 of the Student Digital Notebook Data Visualisation
Development
Create 3D population map in TinkerCAD by applying the following steps:
- Copy and TInker the “Australian States #Map”.
- Edit the height of each state according to the collected data
(Note: for scaling, it may be helpful to treat a height of “100.00” as 100% and scale the statistics in relation to this – e.g. 20% is 20.00, 50% is 50.00, etc.). - Export file as an “.OBJ” file
Cospaces
Students import OBJ file into Cospaces in order to view this data on a Merge Cube in Augmented Reality by following the steps below
- Select “Upload”
- Select “3D models”
- Navigate to the folder where your TinkerCAD “.OBJ” file was saved
- Drag the file into your Cospace once it has finished uploading
Conclusion
Ask students to reflect and share their data visualisations using CoSpaces EDU by sharing the link/ QR code. Students will be able to view each other’s creations in VR or AR by scanning each other’s QR codes.
Students complete the reflection sheet on page 8 of the Student Digital Notebook Data Visualisation.
See a completed version here.
Download the PDF for more information
More Resources, Lessons Plans & Tutorials
Resource
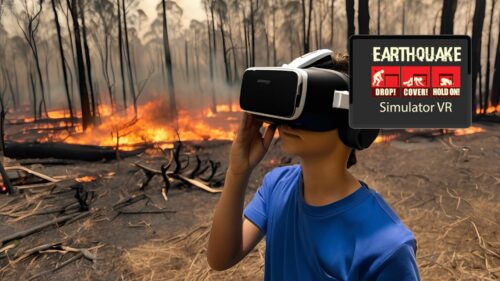
Natural Disasters
Students will explore how natural disasters like earthquakes, bushfires, droughts, and cyclones impa...
Resource
The Power of Colour
This lesson invites students to explore how colours and visual conventions in art can convey differe...
Resource
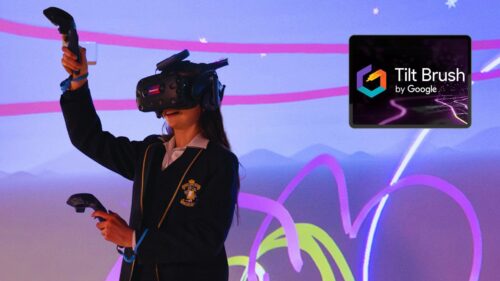
Inspired Artworks
In this lesson, students will use immersive technology to explore different artistic styles and crea...

Resource
Exploring Circuits
In this lesson, students will explore the principles of energy transfer and transformation through h...